A pile of birth control pills and a woman sitting against a wall looking stressed

Contraceptive Access Maps

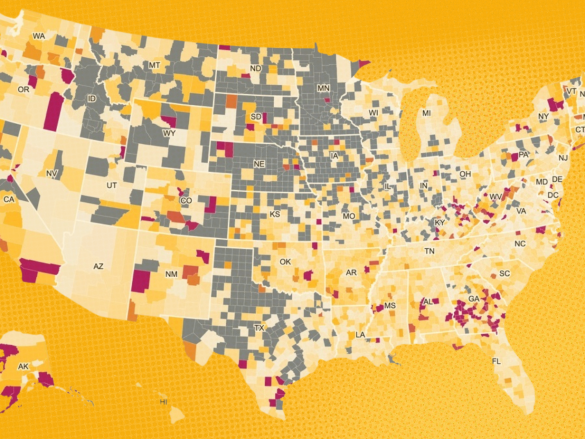
The Contraceptive Access Maps depict county-level gaps or alignment between women’s* self-defined contraceptive needs and clinic-based service availability. If there is misalignment between need and availability, the county is considered a Contraceptive Access Gap.

We offer two views of access: 

  1. Alignment between availability of publicly funded health centers providing any contraceptive care and women’s* need for this care.
  2. Alignment between availability of publicly funded health centers that offer the full range of birth control methods and women’s need for contraception.
     

Key Findings

New data from Power to Decide and Guttmacher shows that 21.4 million women* of reproductive age in the United States in need of low- or no- cost contraception live in a county with an access gap—where the need for publicly funded services is greater than the availability of these services. Out of these 21.4 million women in need: 
 

  • Almost 75% of these women (15.7 million women) live in a county with an extreme gap in access—where service availability meets only 25% of the need or less.
  • Over 1 million women in need of low- or no- cost contraception live in a county without a single publicly funded health center offering any contraceptive care.
  • 1.9 million women who live in a county without access to a health center that offers the full range of birth control methods (see below for the range of contraception methods and definitions). 

* While we use the term "women" to align with our data sources, which do not always collect information about sex or gender consistently, we recognize that contraception is used by people with diverse gender identities. Every person, regardless of their sex or gender identity, deserves access to the contraceptive care that meets their needs and preferences. Where possible, we use gender-inclusive language to represent the cisgender women, transgender men, nonbinary people, and other gender diverse people who need and use contraception.

Share the state of contraception access in your state


Many factors influence whether or not someone is able to get the contraceptive care and methods they need and want, and publicly funded clinics serve people in a variety of circumstances beyond just financial need. Whether it is the closest clinic, the one with a trusted provider, or the one that offers privacy protections, the network of publicly funded health centers plays an important role in linking people to contraceptive care in line with their needs and preferences.  

Have questions about the Contraceptive Access Maps? Reach out to us!

A New Way of Defining Contraceptive Access

Building from past work identifying counties considered to be “contraceptive deserts,” Power to Decide is proud to partner with the Guttmacher Institute to create a new approach: Contraceptive Access Maps.

The change reflects a fundamental shift in how we understand and measure contraceptive access. This work centers people’s lived experiences by incorporating a more person-centered lens—capturing individuals’ self-defined need for contraception rather than relying on traditional proxies—and draws on contraceptive patient caseload data by clinic type to ground calculations of clinic availability in the realities of local sexual and reproductive health care delivery.

The Contraceptive Access Maps offer a more accurate and nuanced picture of access to publicly funded contraceptive services across the country, including all publicly funded health centers providing any contraceptive care and publicly funded health centers that provide the full range of birth control methods to the general public. Together, this collaborative endeavor advances a more person-centered approach to understanding contraceptive care—helping to ensure that data better reflect the needs of individuals and communities.

Are you a clinic interested in being listed in Bedsider’s Clinic Finder? Click here to learn more
 

How to Read the Map

The Contraceptive Access Maps show where there is alignment or a gap between the number of women with a self-defined need for contraception who likely need public funding for contraceptive care and the availability of that care through brick-and-mortar clinics providing contraceptive methods at low or no cost in their county.

Two maps are presented to represent two distinct landscapes of contraceptive access: (1) alignment between availability of publicly funded health centers providing any contraceptive care and women’s need for this care; and (2) alignment between availability of publicly funded health centers that offer the full range of birth control methods and women’s need for contraception. See below for more detailed explanations of each of these concepts.

Estimated number of patients served by clinics in county/Estimated number of women with self-defined contraceptive need in county who likely need public funding for this care = level of alignment/access gap.

The shade of gray depicts counties without any health centers providing low- or no-cost services, or a total gap between county-level clinic availability and need. As the map grows from the lightest shade of white to yellow and darker orange, the gap between what clinics can provide and what women living in the county need shrinks. Deep magenta depicts the closest alignment between clinic availability and self-defined need for contraception.

Importantly, while there are some counties in the country where we’ve estimated 100% access, or full alignment between clinic availability and contraceptive need, individuals may still face additional challenges in accessing care. Please see our access view limitations for more details.

Support our work and turn this whole map Magenta, the colors of access

How Power to Decide Combats Access Gaps

Focusing only on the 21 million women who live in counties with contraceptive access gaps tells only part of the story. We know that proximity to a clinic is only one piece of the access puzzle.

Power to Decide works to expand access in multiple ways—ensuring people have access to medically accurate information and the trusted resources they need, supporting providers in delivering high-quality, person-centered care, and advancing policies that create more equitable and supportive environments.

  • Deliver trusted, medically accurate information through Bedsider, connect individuals to care with tools like the Clinic Finder, so people can have the tools and resources they need to take control of their contraceptive options.
  • Equip providers with evidence-based resources, training, and tools—like Bedsider Providers—to support high-quality, person-centered contraceptive care.
    Advance and defend policies that expand contraceptive access, leverage data to identify gaps, and partner with congressional leaders to drive solutions for those facing the greatest barriers to care.
  • Track trends in how young people access information, perceive birth control, and experience care through our Youth Reproductive Health Access (YouR HeAlth) Survey—so we can stay responsive to their needs, preferences, and lived experiences.
  • Combat misinformation and disinformation by meeting young people where they are—on social media—with trusted, medically accurate information on reproductive and sexual health.
     
About the Contraceptive Access Maps

The Contraceptive Access Maps are a collaborative effort between Power to Decide and the Guttmacher Institute to re-conceptualize county-level access to low- and no-cost contraception across the United States. Informed by extensive consultations with diverse experts and stakeholders, the updated maps are grounded in the current realities of sexual and reproductive health care.

To understand contraceptive access in each county across the country, we draw on multiple data inputs to inform two distinct metrics: (1) alignment between availability of publicly funded health centers providing any contraceptive method and women’s self-defined need for this care; and (2) alignment between availability of publicly funded health centers that provide the full range of birth control methods and women’s self-defined need for contraception. These data inputs include:

  1. The number of publicly-funded clinics in the county offering (a) any contraceptive method, and (b) IUDs and implants on site. For our purposes, publicly-funded clinics include sites that offer contraceptive services to the general public and receive at least some public funds (e.g., federal, state, or local funding through programs such as Title X or the federally qualified health center (FQHC) program), to provide free or reduced-fee services to qualifying patients. These sites are operated by a diverse range of providers, including public health departments, Planned Parenthood affiliates, FQHCs, and other independent organizations.

    1. Clinics in this category provide any clinic-based contraceptive method.
    2. Clinics in this category are those that provide IUDs and Implants. We use providing IUDs and implants as a proxy for providing the full range of FDA-approved methods (such as birth control pills, the shot, the ring, the patch, and emergency contraception) because health centers that can provide these more costly methods are typically able to offer a range of other methods as well.

    Data Source: Health center data is pulled from our Bedsider Clinic Finder, which compiles health centers across the country. The map includes data representing more than 7,000 health centers. The data come from multiple verified sources, including Title X clinics, Planned Parenthood affiliates, Federally Qualified Health Centers, and county and state government programs. Power to Decide manages this nationwide compilation of data, which also includes Puerto Rico. The map does not draw on data from private providers who take Medicaid or groups of clinics for specific subpopulations and can not be accessed by the general public, such as Indian Health Services, VA centers, college health centers, teen-only clinics, or school-based health centers. The Bedsider Clinic Finder was first published in 2011. Power to Decide last completed a full update of clinic information between January 2020 and March 2023 and continues to update clinic information on a rolling basis.

    Complete this form if you are interested in learning about being listed


  2. Average patient caseloads by clinic type. We use county-specific caseload averages provided by the Guttmacher Institute to estimate the number of patients who could be served in each county. These averages reflect the typical number of patients receiving contraceptive services annually by clinic type in a given county. When county-level caseload data are not available for a specific clinic type, the value is imputed from the average caseloads of counties with similar urbanicity and population size—drawing first from counties within the same state, then from the broader DHHS/Title X region or national data, depending on how many similar counties are available at each level.

    Data Source: Data for the caseload averages come from Guttmacher’s Family Planning Census, which collected data about all of the publicly supported agencies and clinics that provided contraceptive services in 2020. Using annual patient counts, Guttmacher calculated county-specific caseload averages for 3 clinic types: Planned Parenthoods, Health Departments, and other clinics that provide contraceptive services (including FQHCs and independent organizations that receive Title X funds).  Of the 3,144 counties in the analysis, 412 (13.1%)  were missing an observed county-level patient caseload for at least one clinic type. For these counties, caseload values were imputed using a cell-based mean approach, in which each missing value is filled with the average of observed counties sharing the same urbanicity category and population-size group, at the narrowest geographic level with at least three comparable counties.


  3. The estimates of women with a self-defined need for contraception who likely need public funding for contraceptive care in the county, calculated as the sum of women under age 20 and women ages 20-49 under 250% of the federal poverty level who indicate a self-defined need for contraceptive services—a novel measure developed by the Guttmacher Institute.

    Determination of self-defined need is based on reported recent use of contraception or contraceptive services or reporting a desire to use contraception if financial barriers were not an issue. These estimates consider the need for contraceptive services for any reason, not solely for the purpose of preventing pregnancy. To focus on those who likely need public funding to obtain contraceptive services, we limit the total number of women with a self-defined contraceptive need to those who are 20-49 with a family income below 250% of the federal poverty level (FPL; less than $62,150 for a family of three in 2023) or are younger than 20. All adolescents who have a self-defined need for contraceptive services, regardless of their family income, are assumed to have a likely need for publicly funded contraceptive care because of their heightened need for confidentiality in obtaining care (which may not be provided if they depend on their family’s resources or private insurance).

    Data source:  These data come from Guttmacher’s 2023 Self-Identified Need tables. To learn more about their methodology, you can read their report here

Calculation of Contraceptive Access Metrics

We conceptualize county-level access as the alignment between women’s needs for contraception and the availability of publicly funded clinics providing contraceptive services in the county. Specifically, we construct two distinct measures of availability—one for all health centers providing any contraceptive method and one for health centers that provide the full range of birth control methods. For each, we estimate the total patients served in a county by multiplying the number of clinics of each type by that type’s average caseload and summing across types.

To calculate preliminary alignment estimates, we divided each of these availability measures by the number of women with a self-defined need for contraception who likely need public funding for contraceptive care in the county.  We capped these preliminary alignment estimates at 1.0 and then applied a distance penalty to counties where estimated travel distance to the nearest clinic exceeded the federal standard for that county’s urbanicity type. These thresholds come from the Centers for Medicare and Medicaid Services (CMS) network adequacy standards for OB/GYN services under Medicaid managed care, which specify the maximum distance considered acceptable for patients to travel to reach OB/GYN care: 10 miles for metro counties, 20 miles for micropolitan counties, and 30 miles for rural counties. We calculated estimated distance to the nearest clinic of the relevant type within each county using a nearest-neighbor formula: Estimated distance = 0.5 × √(county land area / number of clinics). For counties where estimated distance exceeded the CMS threshold, the raw alignment score was multiplied by an exponential decay factor:exp(−(estimated distance − threshold) / threshold). Of the 2,367 counties with at least one clinic, 305 (12.9%) received a distance penalty on the all-clinics metric. Of the 1,916 counties with at least one full-range clinic, 395 (20.6%) received a distance penalty on the full-range metric.
 

Limitations

The current initiative is only one way of looking at access: a county-level view of the extent to which available clinics offering either any contraceptive care or specifically the full range of birth control methods at low or no cost are aligned with women’s contraceptive needs.

The map doesn’t depict the population of people who, regardless of financial need, trust and rely on these health centers. Included in this group are people who may choose not to use their insurance for privacy reasons, travel outside their area to keep their contraceptive use private from a partner—a common situation tied to birth control sabotage or coercion—or need a provider who speaks their language or offers hours that fit their work schedule. All people should be able to access care in line with their needs and preferences without significant barriers.

In addition, our analysis of county-level access is limited in that it does not fully represent one’s proximity to a health center. For many, the presence of a clinic, even in their county, does not translate into access. In many areas of the country, a high percentage of people lack access to a vehicle or other form of transportation.

We also only count brick-and-mortar clinics and do not account for services provided via telehealth, or online birth control providers, or at pharmacies. We cannot account for contraceptive methods, like condoms or Opill, that are available over-the-counter.

Additional data limitations:

A limitation of our approach is using data from different years for the numerator and denominator. Because of the effort and time involved in collecting and analyzing data from health centers across the country, 2020 is the most recent data we have on caseload averages.   Given the rapidly shifting nature of care, our caseload averages from 2020 may no longer reflect clinic service availability.

There may be limitations to our patient caseload averages. To calculate the caseload averages, we grouped clinics into three categories to align Power to Decide and Guttmacher’s data: Planned Parenthoods, Health Departments, and other clinics that provide contraceptive services (this includes all other clinics in our database such as FQHCs and independent organizations that receive Title X funds). In particular, the “other” category may over- or underestimate network availability. We have tried to alleviate this concern by drawing on county-specific caseload averages to more closely estimate availability specific to county contexts.

Finally, our distance adjustment is an approximation with notable limitations. We estimate the distance to the nearest clinic from a county's land area and clinic count rather than from actual clinic locations, so the adjustment captures the general relationship between clinic density and travel burden rather than any individual's true travel distance. It also assumes a single federal distance standard for each urbanicity type and does not account for variation in road networks, terrain, or the distribution of clinics within a county.